
Sometimes, the best signal isn’t a complex calculation—it’s simple agreement. The Synchron methodology is built precisely on this principle: it waits for two independent indicators—EMA and MACD—to simultaneously point in the same direction.
Here, the moving average establishes the short-term trend context, while the oscillator confirms the presence of momentum. When both “look the same way,” the probability of continued movement over the next 15–30 minutes becomes high.
This strategy doesn’t require analyzing support/resistance levels, volume, or news events. All you need is an M5 chart, an EMA with a period of 20, and the standard MACD—both tools are built into the CloseOption platform and can be set up in just a couple of clicks.
How the Signal for a Digital Option Is Generated
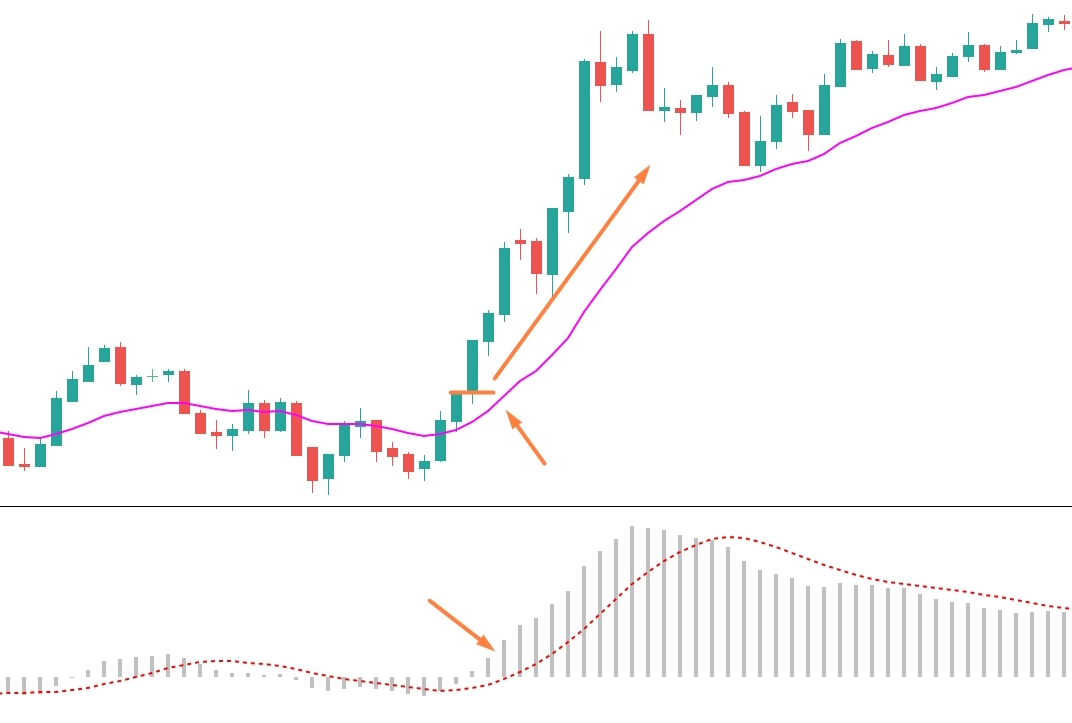
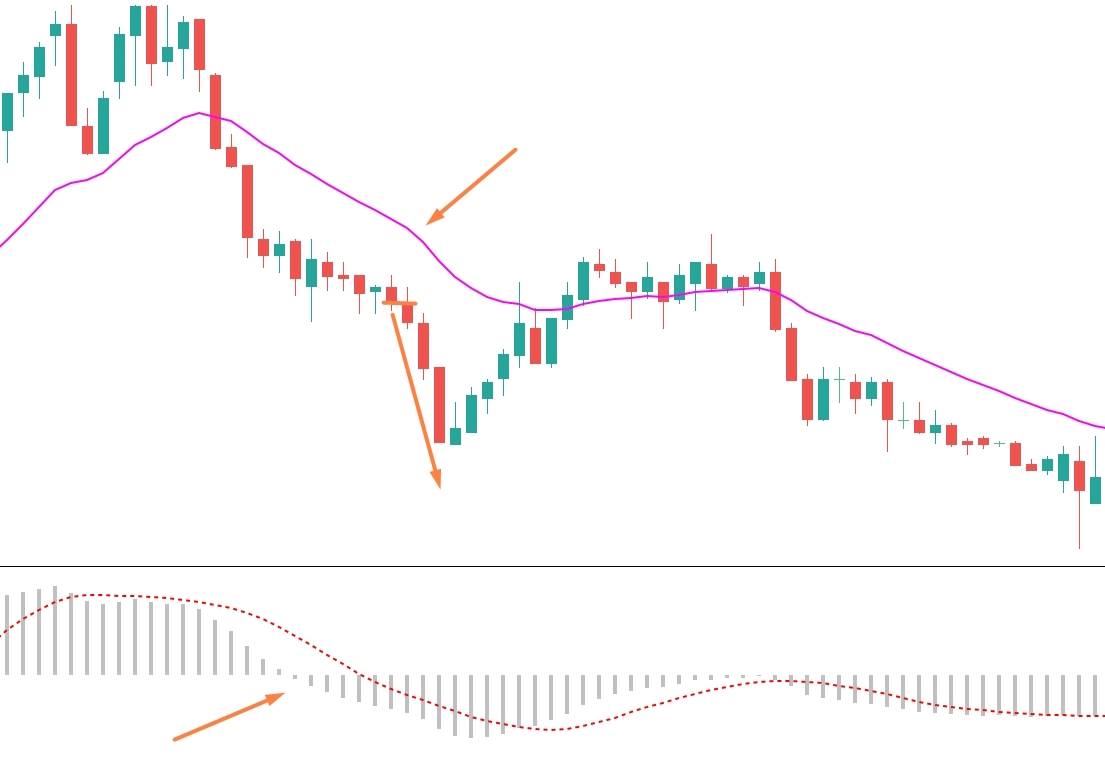
First, assess the price position relative to the exponential moving average (EMA). If the price consistently stays above the EMA—for two or three consecutive candles without returning to it—that creates a bullish context. If it stays below, it indicates a bearish context. On its own, this isn’t yet a trade signal, but it determines which MACD signals will be considered valid.
Next, examine the MACD histogram. What matters isn’t the crossover of the MACD lines, but the change in sign of the histogram:
- If the histogram moves from the negative zone into the positive zone (bars rise above the zero line and continue growing), this indicates strengthening bullish momentum.
- Conversely, if it shifts from positive to negative (bars fall below zero and deepen), bearish pressure is increasing.
An entry signal is triggered when:
- Price is above EMA(20) and the MACD histogram has just crossed into positive territory and continues rising → CALL.
- Price is below EMA(20) and the MACD histogram has just turned negative and keeps falling → PUT.
Important: Entry should occur not at the exact moment the histogram crosses the zero line, but on the close of the first candle after which the histogram has clearly entered the new zone. This eliminates false signals caused by “jitter” around the zero level.
Expiration time: 15–20 minutes. This window is long enough for the momentum to unfold, yet short enough to avoid market reassessments that could reverse the move.
Why This Strategy Works Well in Digital Options Trading
An EMA with a period of 20 is sensitive enough to react to short-term changes, but not so sensitive that it whipsaws with every minor fluctuation. Meanwhile, MACD excels at detecting shifts in acceleration momentum—especially at the very start of a move. Together, they filter out scenarios where, for example, price moves above the EMA but lacks real momentum (flat or declining histogram)—moves that often end in false breakouts.
The strategy performs especially well during the first half of the trading day, when the European session is gaining momentum and price action remains relatively predictable.
Synchron is a trading methodology for those who value clarity within a pragmatic framework. It doesn’t try to guess the market or build elaborate forecasts. It simply waits until two proven indicators say the same thing—and then acts. Because in trading, as in life, agreement is a sign of strength. And when price and momentum move in step, it’s wise to follow.