
This system is based on the universal market principle of mean reversion. It states that any sharp deviation of price from its “normal” level — whether a moving average, daily range, or simply an equilibrium zone — will eventually be compensated by a reverse movement. “Return to Equilibrium” does not attempt to catch the beginning of a trend. Instead, it waits until price moves too far away — and enters the market only when the probability of a pullback becomes statistically high.
Only two tools are required for implementation:
- EMA with period 50 — serving as an “anchor” or equilibrium reference.
- Bollinger Bands — measuring the degree of price deviation.
Both indicators are built into the CloseOption trading platform and can be configured in seconds.
How the Signal Is Formed
First, assess price position relative to the Bollinger Bands:
- When price touches or breaches the upper band, it indicates strong short-term overbought conditions.
- When price touches the lower band, it signals oversold conditions.
However, the touch itself is not yet a signal. Many traders make the mistake of entering a trade immediately upon breaching the band, without waiting for confirmation.
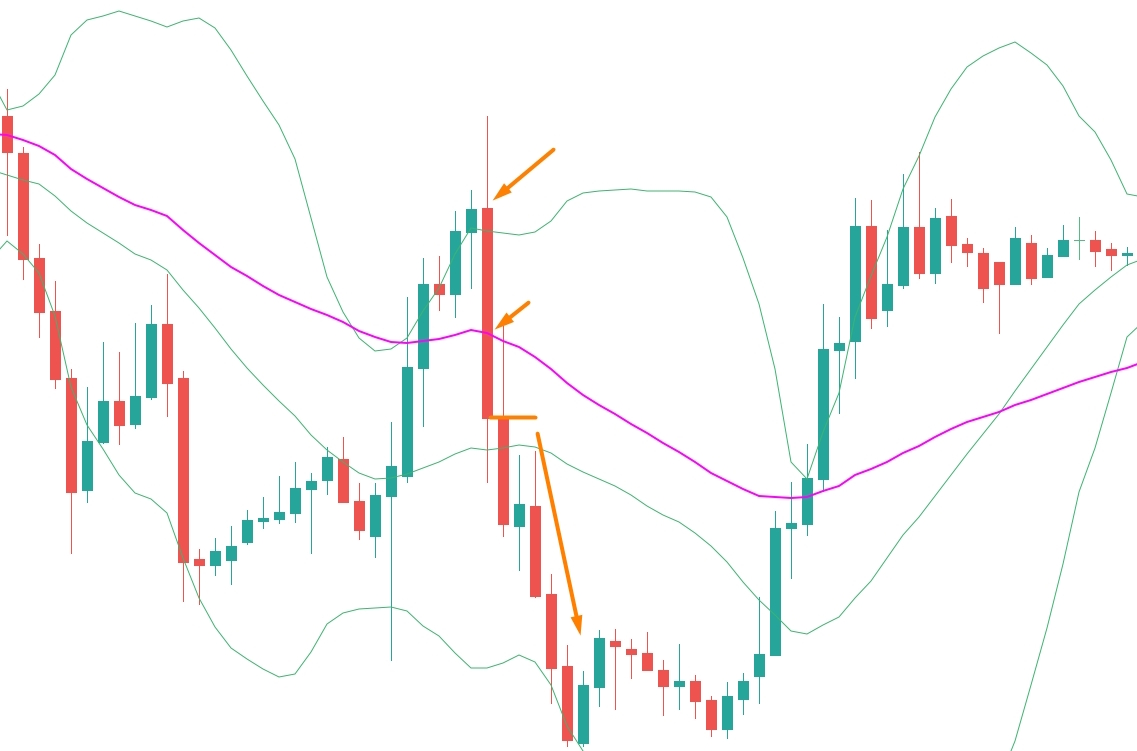
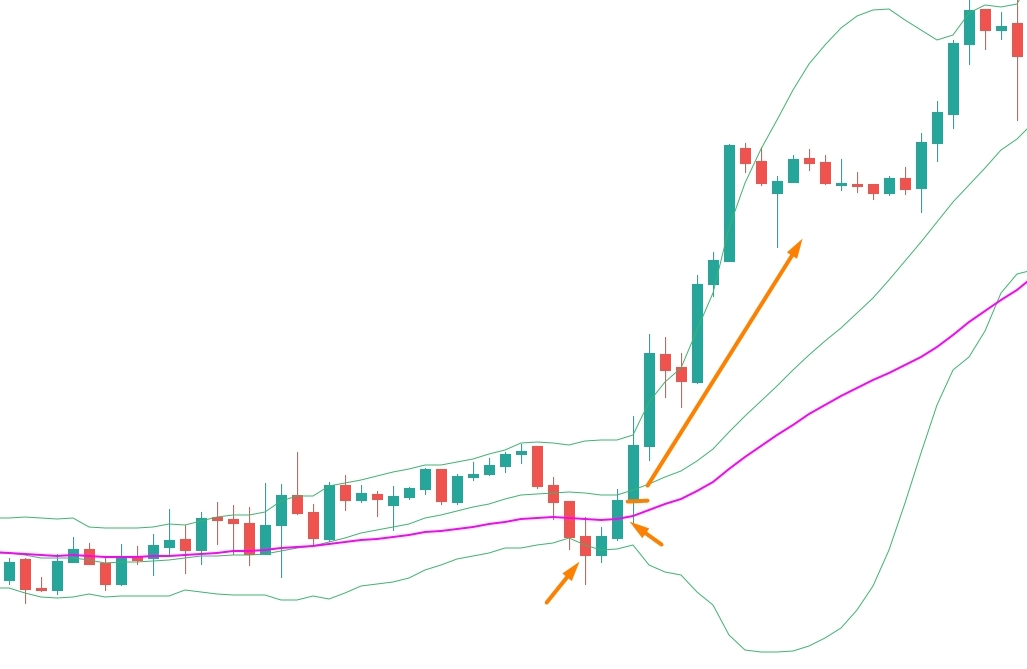
The true entry occurs when price, after breaking beyond the Bollinger boundary, returns inside the channel and simultaneously crosses the EMA in the opposite direction.
Examples:
- Price surges sharply, breaks above the upper band, then reverses and closes below the moving average → this is a clear PUT signal.
- Price drops below the lower band, then rebounds and closes above EMA(50) → this is a CALL signal.
Important: The EMA crossover must occur on the same candle as the channel re-entry, or on the very next candle. If price “lingers” outside the channel for too long, the signal loses its validity.
Expiry time: 15–25 minutes. This duration is sufficient for the market to correct its overheating, but not so long that a new directional movement begins.
Why This Works
Bollinger Bands respond dynamically to volatility: during calm periods, the channel narrows, making breakouts beyond its boundaries more significant.
EMA(50), in turn, smooths out market noise and shows where the current “center of gravity” of price resides.
Their combined use filters out false reversals — for example, when price touches the upper band but the EMA is trending upward and price immediately continues its rise.
Advantages and Limitations of the Strategy
Key advantage: “Return to Equilibrium” demonstrates remarkable stability during ranging markets and periods of moderate volatility. During such times — when trend-following strategies often generate false breakouts — this system truly shines: pullbacks from Bollinger Band boundaries occur with high regularity.
Additional benefits:
- Visual transparency: signals are easy to recognize even when rapidly switching between assets.
- Minimal per-trade risk: thanks to clear entry rules and short expiry periods.
Limitations: The strategy does not perform well during strong, impulsive trends — for example, following major news releases or macroeconomic data publications. During such moments, price may remain outside the channel for extended periods, and attempts to “catch a falling knife” or “stand under a falling rock” lead to losses.
Therefore, the strategy requires a simple filter: If price has moved more than 1.5× the width of the Bollinger Bands over the last 30 minutes — temporarily pause trading.
Also avoid trading during the first 15 minutes after session open, when volatility is unstable.
Outside these conditions — with discipline and patience — “Return to Equilibrium” remains one of the most reliable tools for measured, controlled trading on CloseOption.
“Return to Equilibrium” is a strategy for the patient trader. It does not require split-second reactions or chasing every impulse. It teaches one simple truth: the market, like a pendulum, cannot remain in an extreme position for long. Sooner or later, it will return to the center. And your task is not to push it — but simply to be ready when it begins moving back.