Momentum is one of the oldest yet still highly relevant technical analysis indicators available to traders on the CloseOption platform. Unlike many other tools, it does not show which direction the price will move, nor does it indicate whether the market is overbought or oversold. Its task is to answer one simple question: is the movement accelerating or decelerating?
This is especially valuable in binary options trading, where it is important not merely to guess the direction, but to understand whether the movement has sufficient strength to reach its target within a fixed timeframe. Momentum helps precisely with this—it functions as the market’s “speedometer.”
How the Indicator Works and What It Shows
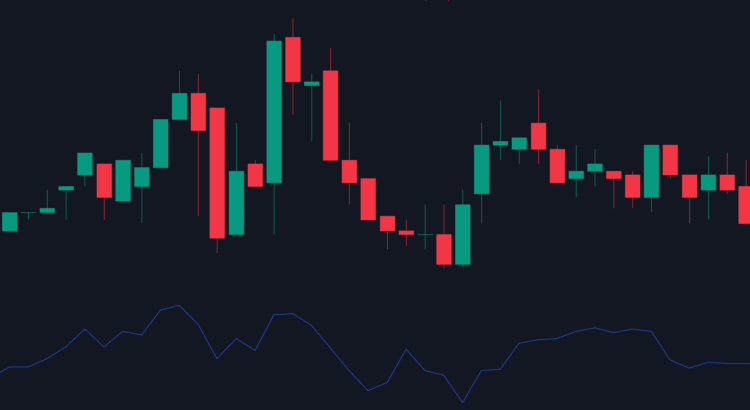
This advisor is displayed in a separate window below the price chart as a moving average oscillating around a central level—100. Its calculation is based on comparing the current closing price with the price recorded several periods earlier (by default—10 candles). If the price has risen during this time, Momentum will be above 100; if it has fallen—below 100. The farther the value is from the central level, the stronger the change.
The standard period in CloseOption settings is 10, and it generally does not need to be changed. This parameter is optimally balanced: it is sensitive to meaningful changes but does not react to every minor market noise.
How to Use Momentum in Practice
The primary method of application is searching for divergences—that is, discrepancies between price action and the indicator. For example, the price makes a new high, but the advisor forms a lower peak at the same time. This signals a weakening impulse and a potential reversal or correction. Such a signal is especially reliable when it coincides with a resistance zone or an overbought reading from other tools.
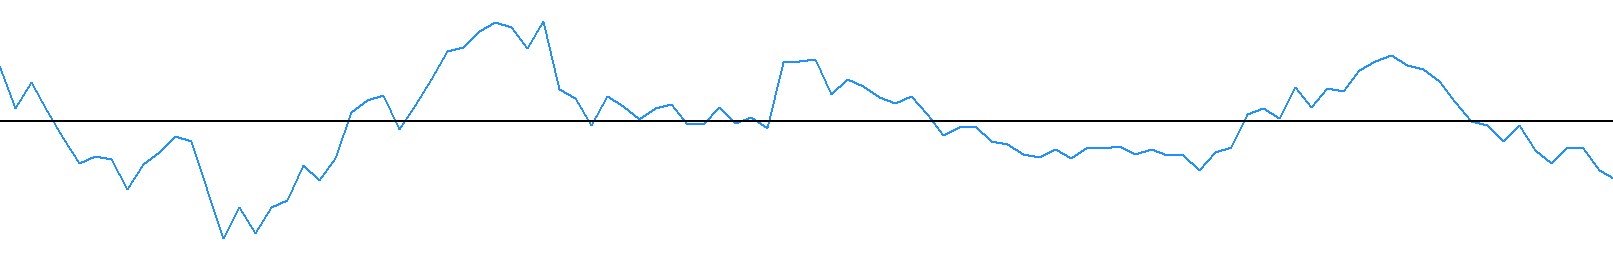
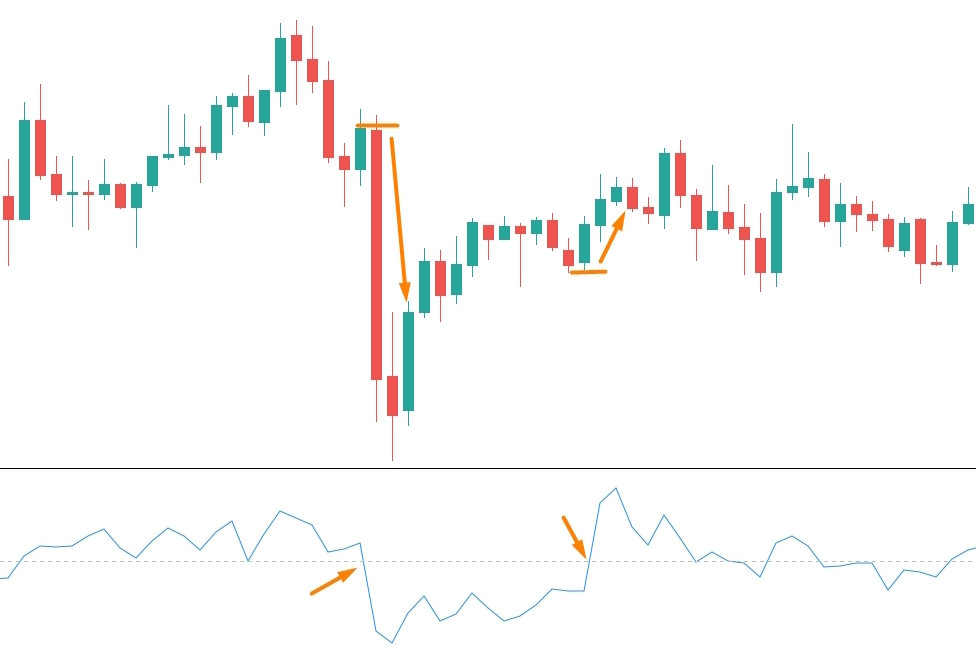
A second approach involves tracking crossovers of the 100 level. When the Momentum line rises above 100, it indicates that the current price is higher than it was 10 candles ago—meaning upward momentum is gaining strength. A move below 100, conversely, signals increasing downward pressure. A particularly strong signal occurs when the crossover happens with acceleration: the line breaks sharply away from the level rather than drifting along it.
Important: By itself, this tool does not provide entry points. It does not say “buy now.” It merely states: the movement is slowing down or picking up speed. Therefore, it is best used in combination with other indicators—for example, a trend-following EMA or the RSI oscillator. If the price bounces off support, RSI exits the oversold zone, and Momentum simultaneously crosses above 100—such a combined signal has a significantly higher probability of success.
Practical Usage Tips
The advisor can be easily added via the menu: Indicators → Oscillators → Momentum. Here you can adjust the line color, thickness, and period if adaptation to a specific asset or timeframe is required. On M1 and M3 timeframes, the tool becomes highly sensitive—convenient for scalping, but requiring caution. On M15 and H1, it functions as a filter for medium-term momentum.
It is important to understand that Momentum is not a “magic wand,” but a tool for conscious observation. It reminds us: the market is not just about price, but also about its speed. And in digital contracts, what often matters is not where the price will go, but whether it has enough time to get there. With the indicator described above, you begin to feel this rhythm—and act not at random, but in sync with the movement.