
The name of this strategy reflects its essence: it relies on one of the most informative elements of a price chart — a long candle wick followed by a reversal. Such a wick indicates that price attempted to move in one direction but encountered strong opposition and was sharply rejected.
This is a sign of local overheating and the market’s readiness for a correction. The “Impulse Shadow” strategy captures precisely this moment, reinforcing the visual signal with one simple indicator: RSI (7).
All you need to implement this methodology is:
- An M5 timeframe chart,
- The RSI (7) indicator,
- And attention to candle structure.
That’s it — no support/resistance levels, volume analysis, or multi-timeframe confirmation required. The CloseOption trading terminal includes all necessary tools, so you only need to follow the rules outlined in this article to start generating consistent profits from binary options.
How the Signal Is Formed
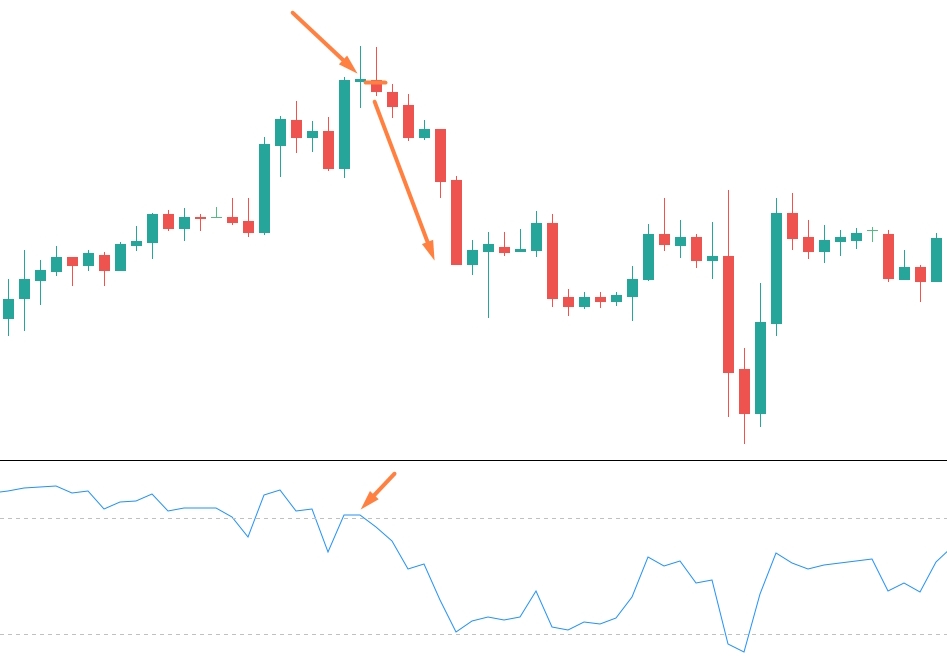
A signal appears when price forms a candle with a long wick in the direction of the short-term trend, yet closes in the opposite half of its range.
For example, during an uptrend, a bullish candle appears with a very long upper wick and a small body near the lower part of the range. This indicates buyers tried to push price higher, but sellers responded with strong pressure. Such a candle is known as a “bullish pin bar” or “bearish rejection within a bullish trend.”
Key condition: At the moment this candle forms, RSI(7) must enter the extreme zone — above 75 (for an upper wick) or below 25 (for a lower wick). This confirms that the impulse was indeed strong but is now beginning to fade.
An additional confirmation is the RSI reversal itself — for instance, a drop from 78 to 72 on the next candle.
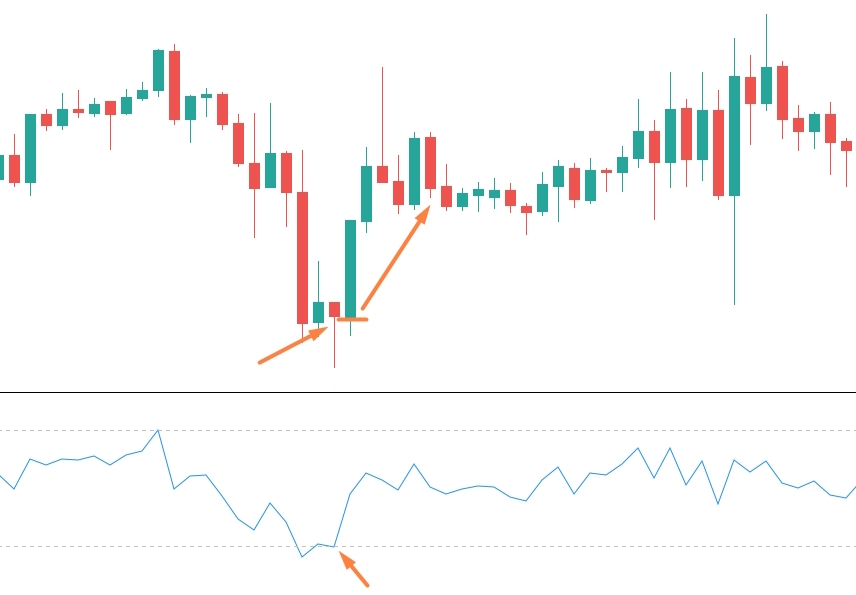
As soon as the candle with the long wick closes and RSI begins reversing from the extreme zone, you open an option against the direction of the wick:
- Long upper wick + RSI > 75 → buy PUT
- Long lower wick + RSI < 25 → buy CALL
Expiry time: 10–20 minutes (equivalent to 2–4 candles on M5). This is sufficient for the market to return to the point from which the impulse originated.
What Counts as a “Long” Wick?
For objectivity, use this simple rule:
- The wick must be at least 1.5 times longer than the candle body,
- And it must exceed the average candle length over the last 10 periods.
In practice, such a wick is visually obvious — it stands out clearly against neighboring candles.
Important: The strategy works best under moderately trending conditions — when price has already moved 20–40 pips in one direction but hasn’t yet reached major structural levels.
In flat markets or during strong news-driven impulses, signals may be less reliable, and trading should be paused during such periods.
Why “Impulse Shadow” Works
“Impulse Shadow” is valued for its speed and clarity. The signal forms within a single candle — no waiting or multi-timeframe confirmation needed. RSI(7) reacts instantly, and its behavior is easy to interpret even for beginners.
Moreover, the strategy generates few false entries because it requires the simultaneous alignment of two factors:
- A visual pattern (the candle),
- And a quantitative confirmation (the RSI).
Another advantage is its adaptability across different assets:
- On moderately volatile currency pairs (EUR/USD, USD/CHF), signals are clear and reliable.
- On cryptocurrencies, signals appear more frequently but with greater movement amplitude.