The Aroon Indicator is one of the most underrated yet highly informative tools in technical analysis. Unlike many trend-following indicators that react only after a trend is already established, Aroon is designed to detect the very earliest stage of trend formation—the precise moment when price begins to emerge from consolidation and a new directional move is “born.” This makes it especially valuable for digital options trading, where the greatest advantage goes to those who enter first.
The name “Aroon” derives from the Sanskrit word “arun,” meaning “dawn.” Indeed, this indicator acts like a “dawn signal”—revealing the birth of a new market move even before it becomes clearly visible on the price chart.
How the Indicator Is Built and How It Works
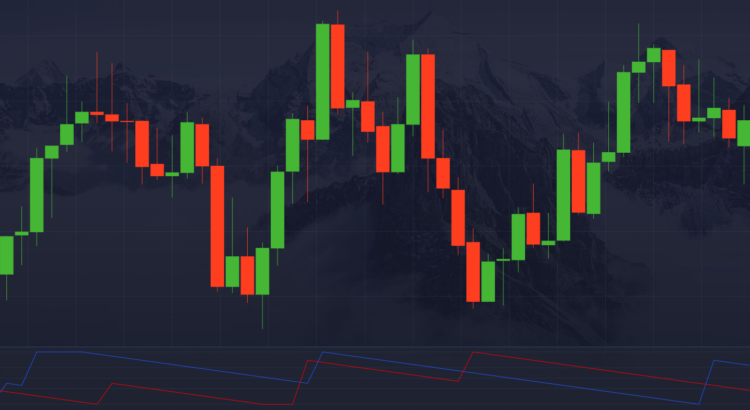
The tool consists of two lines displayed in a separate window beneath the main price chart: Aroon Up and Aroon Down. Both oscillate within a 0–100 range.
- Aroon Up measures how many periods have passed since the most recent local high.
- Aroon Down measures how many periods have passed since the most recent local low.
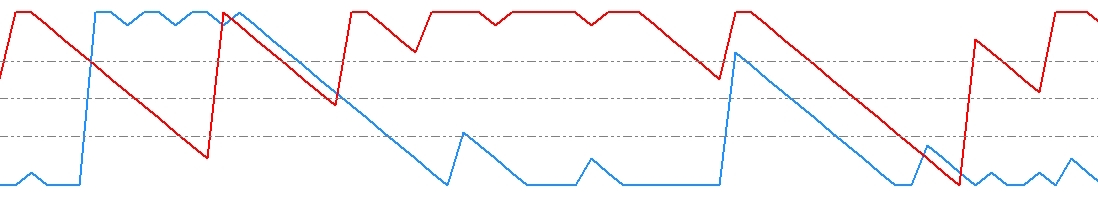
The closer a line is to 100, the more recent the corresponding price extreme; the closer to 0, the farther it lies in the past.
The standard calculation period is 14 candles, which works well for most assets—currency pairs, stocks, and cryptocurrencies. However, when trading shorter expiries (e.g., 1–5 minutes), the period can be reduced to 7–10 to increase the indicator’s sensitivity to rapid market shifts.
Signal Interpretation
The core rule is simple:
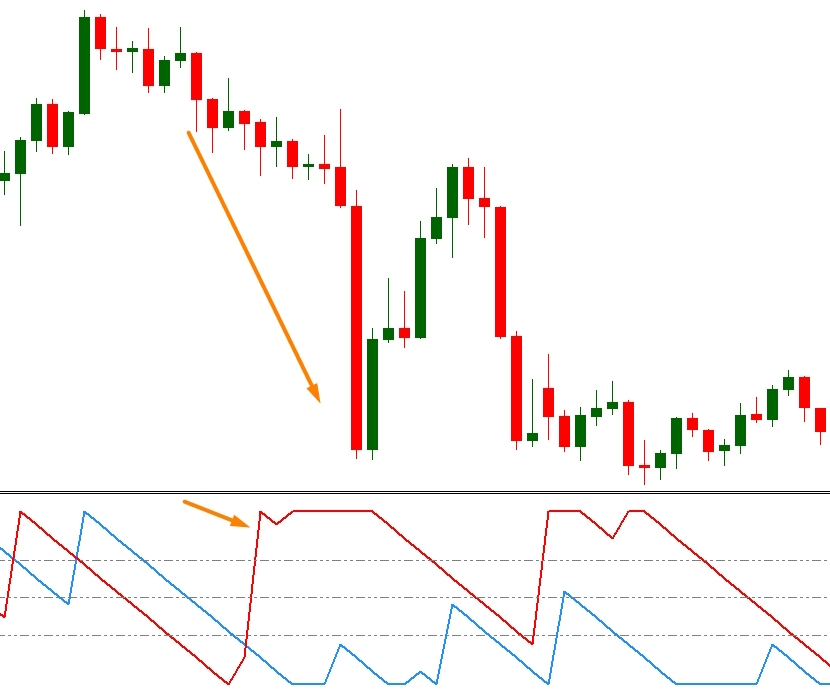
- When Aroon Up rises above Aroon Down, it signals growing buyer strength and a likely start of an upward move.
- Conversely, when Aroon Down dominates, it reflects increasing selling pressure.
A particularly strong signal occurs when Aroon Up climbs above 70 while Aroon Down drops below 30 (or vice versa). Such divergence almost always precedes a sustained directional move over the next few candles.
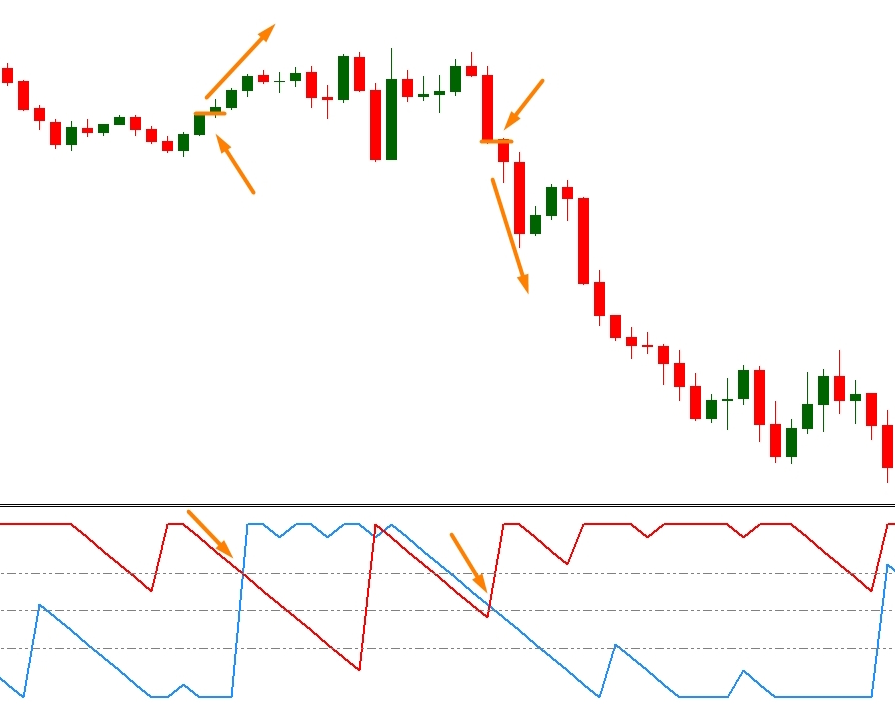
The crossover zone holds special value. Unlike moving averages—where crossovers often lag—Aroon crossovers frequently happen before price begins its decisive move. This allows traders to enter right at the onset of momentum. For example, a CALL option can be placed immediately after Aroon Up crosses above Aroon Down from below—especially if both lines were previously in the lower half of the range (below 50), indicating the market had just emerged from a period of consolidation.
Another useful scenario: when both lines fall below 50, it signals prolonged sideways movement—neither buyers nor sellers are in control. In such cases, it’s best to stay out of the market until one line begins to rise decisively.
Practical Application on CloseOption
On the CloseOption platform, the Aroon Indicator is easily added via the Indicators → Trend menu. Users can adjust the period, line colors, and thickness to fit their preferred visual layout. It integrates seamlessly with other analytical tools—such as support/resistance levels or volume analysis.
For instance, if price approaches a key support/resistance level and Aroon Up starts rising, the probability of a successful breakout—and subsequent continuation—increases significantly.
Important note: Aroon does not measure trend strength—only its age and the direction of its emergence. Therefore, it should not be used in isolation but as part of a confirmation system—ideally combined with momentum oscillators like RSI or MACD.
Aroon is the indicator of choice for traders who prefer to anticipate the market rather than chase it. Thanks to its unique ability to “sense” the start of a move well before a visible price breakout, it opens a window of opportunity for precise, timely entries. On the CloseOption platform, it operates smoothly and without delay—and, when paired with sound trading discipline, can become a reliable compass in uncertain market conditions.