
The core idea behind this strategy is to catch the precise moment when price, after retracing to a strong support or resistance level, receives two independent confirmations that a reversal movement is genuinely beginning. The first confirmation comes from price structure itself—the bounce. The second comes from technical indicators that must align synchronously. When both signals agree, the probability of a successful trade increases sharply.
To implement the “Double Bounce” method, only two tools are required: a 50-period Exponential Moving Average (EMA) and the Stochastic Oscillator (14, 3, 3)—both readily available in the standard indicator set on the CloseOption platform.
How It Works in Practice
The 50-period EMA acts as a dynamic support or resistance level. Unlike static horizontal lines, it continuously adapts to market conditions, remaining relevant even during trend shifts. Price frequently bounces off this moving average, especially on the M5 and M15 timeframes.
Meanwhile, the Stochastic Oscillator helps determine whether price is oversold or overbought at the moment it approaches the EMA. Its role is to confirm that the bounce occurs not at a peak of selling or buying pressure, but rather within an accumulation or distribution zone.
A trade is initiated only under one specific condition: when price touches the EMA(50), and at that exact moment, the Stochastic exits the oversold zone (below 20) for a bullish bounce, or exits the overbought zone (above 80) for a bearish bounce.
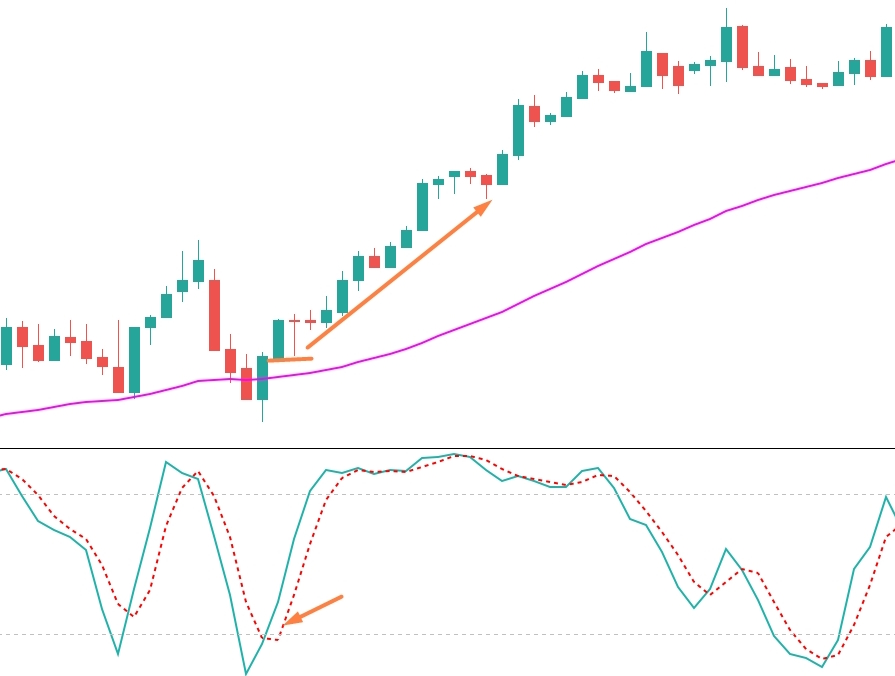
For example, during an uptrend, price pulls back toward the EMA(50). If at that moment the Stochastic dips to 18 and then turns upward—crossing its signal line from below—this constitutes a double confirmation: price has found support at the moving average, and the oscillator confirms renewed buying interest. At this point, a CALL option is opened with an expiration of 15–25 minutes.
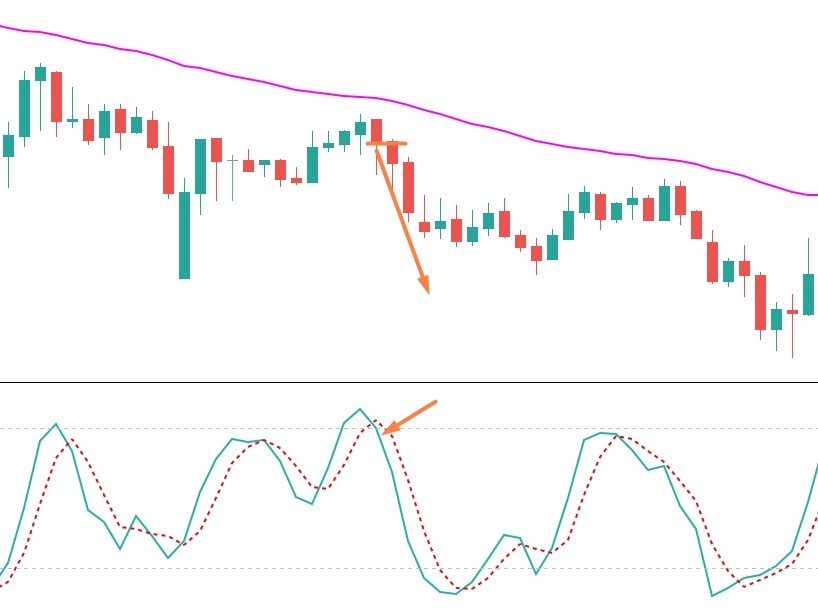
Similarly, in a downtrend: price rallies back toward the EMA(50), the Stochastic rises above 82 and then reverses downward—this is a signal to place a PUT option.
Key Nuances
The strategy deliberately avoids complex filters but includes two essential rules.
First, entries are only allowed if the EMA shows a clear directional slope aligned with the main trend—upward for CALLs, downward for PUTs. If the EMA is flat, the signal is ignored: the market is ranging, and bounces will likely be short-lived.
Second, the candle on which the EMA touch and Stochastic reversal occur must close in the direction of the anticipated move. For instance, when preparing to buy a CALL option, the candle should close above its open—preferably in the upper half of its body.
Why It Works
The simplicity of the “Double Bounce” is its greatest strength. The two indicators complement each other: the EMA defines where a bounce might happen, while the Stochastic indicates when it is most likely to occur. Together, they filter out false signals—situations where price touches the moving average but continues moving through it (e.g., during a strong breakout). In such cases, the Stochastic “catches” the trap—it remains in overbought/oversold territory or fails to reverse.
This methodology does not require volume analysis, support/resistance levels, news monitoring, or multi-timeframe confirmation. A single M5 chart, two indicators, and discipline are all that’s needed. On average, 2–4 high-quality signals appear per trading day—precisely enough for calm, confident trading.
The “Double Bounce” reminds us: reliability isn’t about the number of tools you use, but about the consistency of signals. When price and indicator speak the same language, it’s time to act. And when they don’t—wait. On the CloseOption platform, this strategy can be executed with just a couple of clicks, and its effectiveness has been validated across hundreds of intraday sessions. Sometimes, the strongest weapon is simply the ability to pause—and wait for two clear, simple, yet confident signs.